In work (https://doi.org/10.3847/1538-4357/ac6b37) recently published in The Astrophysical Journal (IF 5.874), we performed observations of the quiet Sun in the frequency range of 20-80 MHz with the Low-Frequency Array (LOFAR), in which we achieved an unprecedented spatial resolution of quiet Sun in decametric wavelengths. A large number of low-frequency (LBA) antennas in LOFAR provide the elementary spatial resolution and sensitivity — we used 24 core stations and 9 remote stations, giving the longest baseline of 48km. A total of 90 GB of data were processed to produce the science images in this work. We used the Cassiopeia-A sky calibrator source to perform calibration on the interferometric observations, and to obtain the precise brightness temperature of the solar emission. The resulting image, shown in Figure X, is produced with an integration time of 2.45h to increase the signal-to-noise ratio and average out the ionospheric fluctuations.
With such calibrated imaging of the quiet Sun, we were able to obtain the brightness temperature of a number of frequency bands with high spatial resolution. In this work, we extended the known relationship between the solar brightness temperature and frequency, Tb(f), to the lowest frequencies observable from the Earth’s surface, thus compensating for the lack of the low-frequency brightness temperature measurements in the literature previously (Figure 1 and 2). Beyond 1 GHz, the brightness temperature of the central region of the Sun can be well described by thermal bremsstrahlung emission with a model of density and temperature distribution of the solar atmosphere, while we find with LOFAR observations in the low-frequency regime that the measured brightness temperature is lower than the same model. We pose that this difference is due to propagation effects (scattering and absorption) of the radio waves in the solar atmosphere.
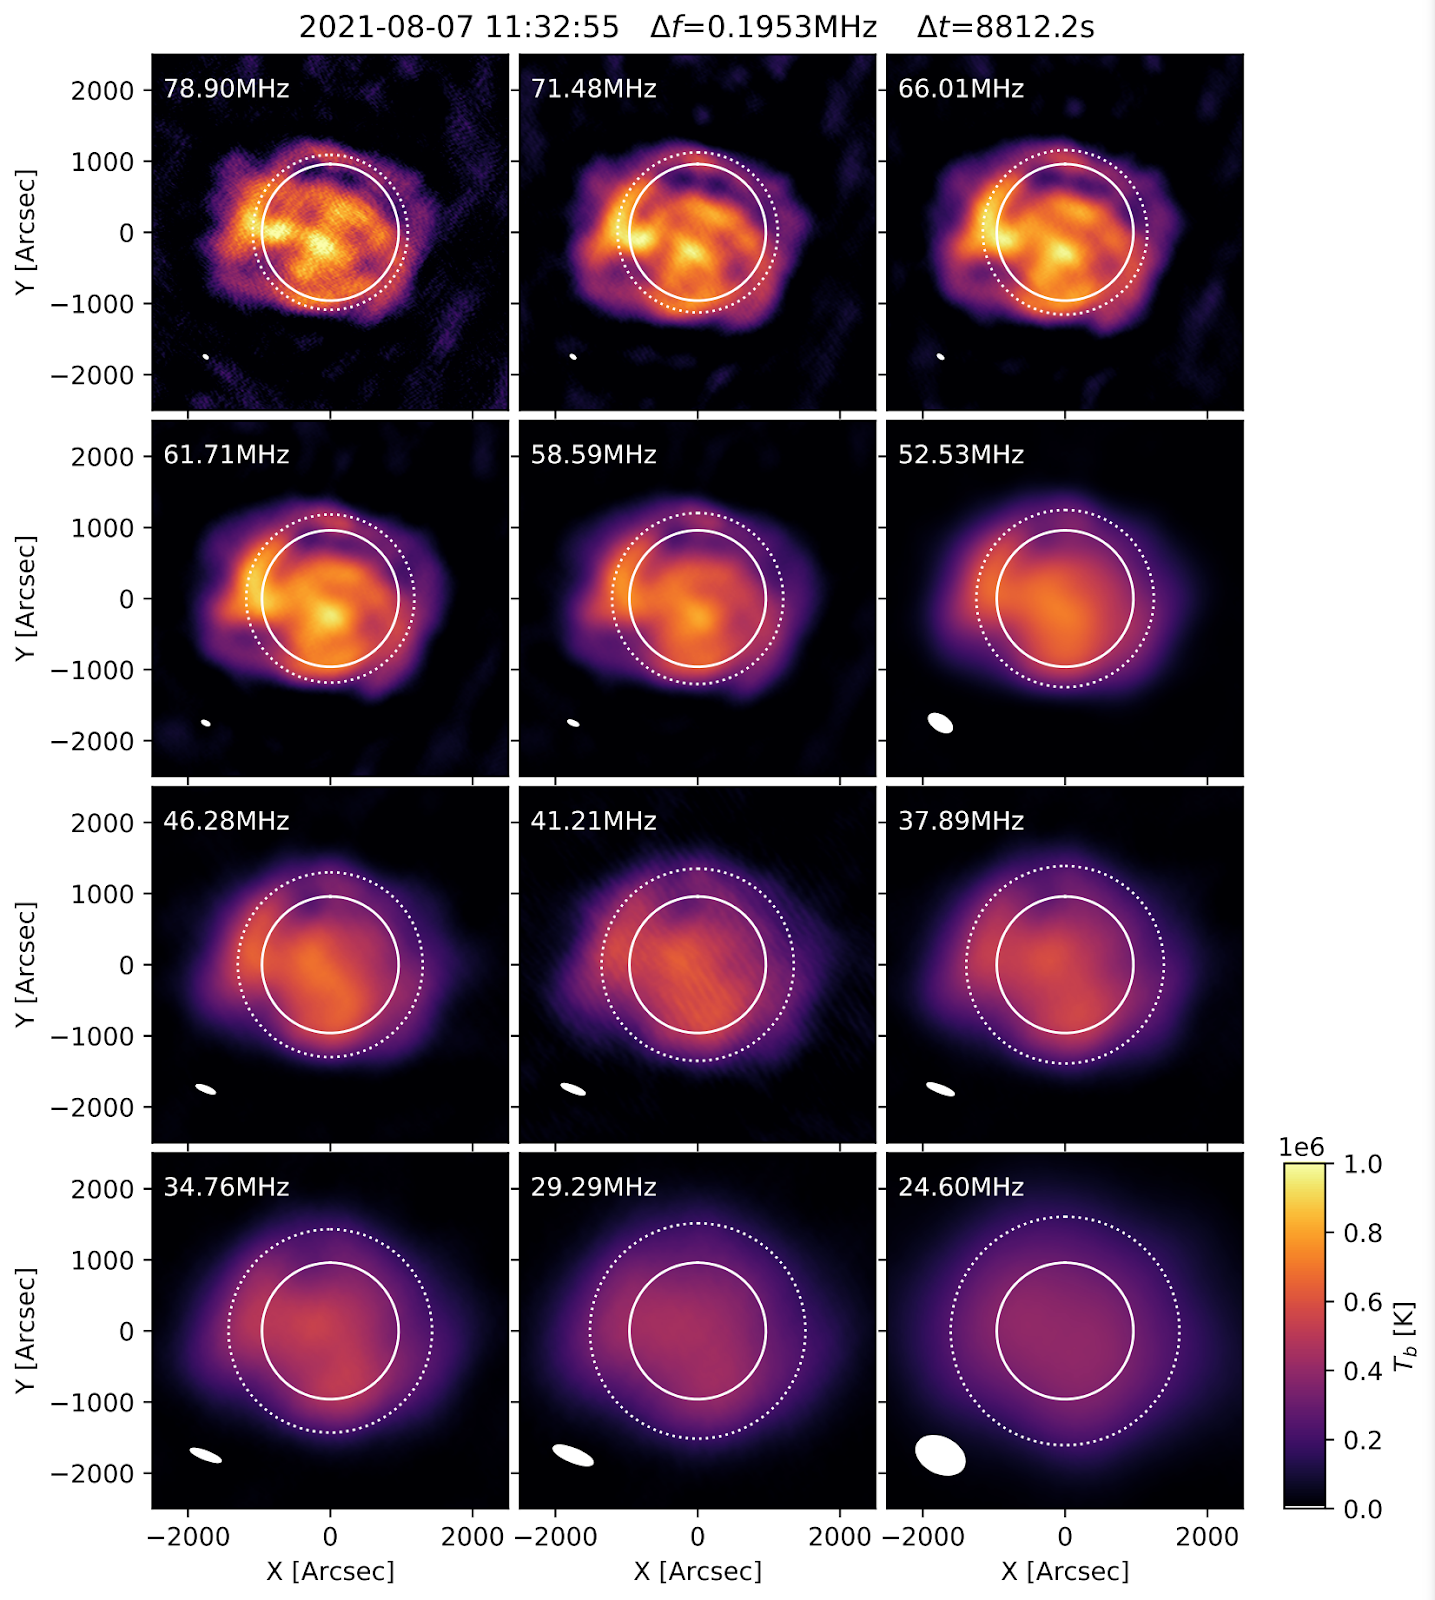
Figure 1. Calibrated interferometric images of the quiet-time solar corona in low frequencies, 24.60–78.90 MHz, observed by LOFAR. The white ellipses denote the instantaneous LOFAR beam. The solid white circles denote the optical solar disk size; the dotted white circles represent the height that would correspond to each frequency assuming it was the local plasma frequency.
![Figure 1. The brightness temperature spectrum observed by LOFAR (red), the modeled brightness temperature (solid black), and the previous observations [3-8].](https://lh3.googleusercontent.com/7tIfnqArIbJ4pDBAQiAS2pAruXUWUyy_riVQnLRYoaTw0dnjbEtMhMUJmkk6bHx9rXmqaauD8yxurqo5cmur650IqgKm2h9zvRAw7m6jl1BmU-B_fB4cIzAgNDeiRTZbTGOMRi_dfmA)
Figure 2. The brightness temperature spectrum observed by LOFAR in our publication (red), the model brightness temperature (solid black), and previous observations.
We have also measured the size of the Sun at low frequencies from the high-resolution imaging, as shown in Figure 3. The size of the Sun decreases with frequency and can be 2.5 times the optical angular size of the Sun near 20 MHz. The size in the east-west direction is significantly larger than in the north-south direction due to the extension of the solar corona. This shows the density and temperature difference near the equator and polar region.
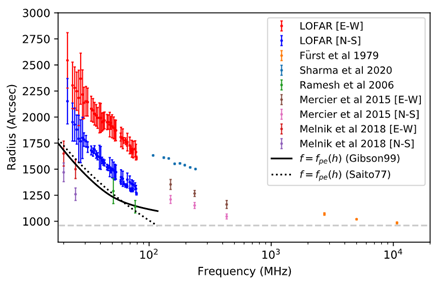
Figure 3. The solar size in different frequencies observed by LOFAR (red and blue), and previous observations.
With high spatial resolution, we see the dramatic change of brightness temperature within small regions of the Sun, marked as blue and green in Figure 4. Тhis implies a large gradient of temperature, plasma density or optical depth difference in the solar atmosphere.
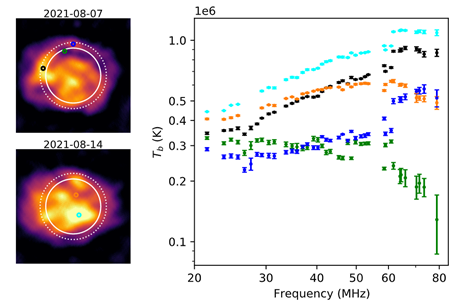
Figure 4. The brightness temperature spectra of a few selected coronal locations.