The quiet-time solar emission at metric-decimetric wavelengths results from a combination of three main emission mechanisms. The dominant emission mechanism is still the thermal bremsstrahlung from the thermal distribution of coronal electrons, and is ubiquitous throughout the solar atmosphere. Close to and above Active Regions (AR) with strong magnetic fields, gyroresonance emission is produced by Lorentz force-accelerated electrons of suprathermal energies 105–106. Finally, at mildly relativistic electron energies (few 100s of keV), gyrosynchrotron emission may occur, producing a smooth spectral shape. This mechanism is the dominant source of high-frequency (>2 GHz) emission observed in solar flares, but its potential contribution has not been well studied. Recent low-frequency observations of CME-related gyrosynchrotron emission beg the question of whether such emission can be relevant for the quiet-time solar corona. We have developed a technique for creating synthetic gyrosynchrotron emission images to compare with actual observations, outlined in a recent publication (https://arxiv.org/abs/2505.00435).
For the modeling of gyrosynchrotron emission, we used the Fast GS Codes simulation suite (Fleishman & Kuznetsov 2010, Kuznetsov & Fleishman 2021). It was initially developed for modeling high-frequency (microwave) solar flare radio emissions. However, it has also been applied to gyrosynchrotron (GS) emission fitting in studies of low-frequency coronal radio emissions, particularly in the Murchison Widefield Array (MWA) range of 80–300 MHz. The main assumption of the model used here is that an electron beam with a power-law distribution is responsible for the emission. The inputs of the model are coronal temperature, thermal plasma density, magnetic field strength, non-thermal electron density, as well as the minimum and maximum energies of the power law electron distribution. In this study, we extended the application of the Fast GS Codes to explore the GS emission domain at the lowest observable frequencies.

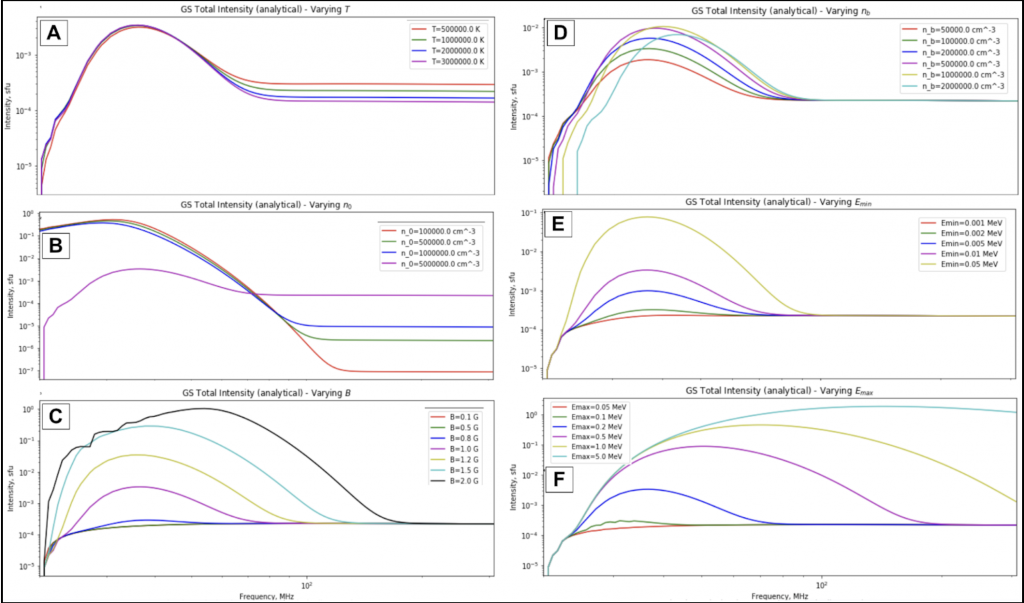
To achieve this, we designed a grid of parameters representative of the low-to-middle corona during a quiet period (Table above), aligning with conditions described in previous studies, such as those summarized by Mondal et al. (2020). The table shows the various combinations of the input parameters to the FastGS code, with letters A-F corresponding to the resulting model spectra, shown in Figure 1. This approach allowed us to investigate 1) whether significant GS emission is possible at these frequencies, 2) what the characteristics of GS emission at these frequencies are, and 3) assess its relevance to observed low-frequency coronal radio emissions.
The results of the GS modeling shown in Fig. 1 demonstrate that there is indeed significant gyrosynchrotron emission possible at frequencies between 20 and 100 MHz under the realistic coronal conditions in Table 1. Most of the models we ran produced coronal brightness 10-3–10-1 solar flux units (sfu), except for the lowest magnetic fields and non-thermal energy ranges. These positive results gave us confidence to continue developing a technique for modeling low-frequency GS emission in the corona.
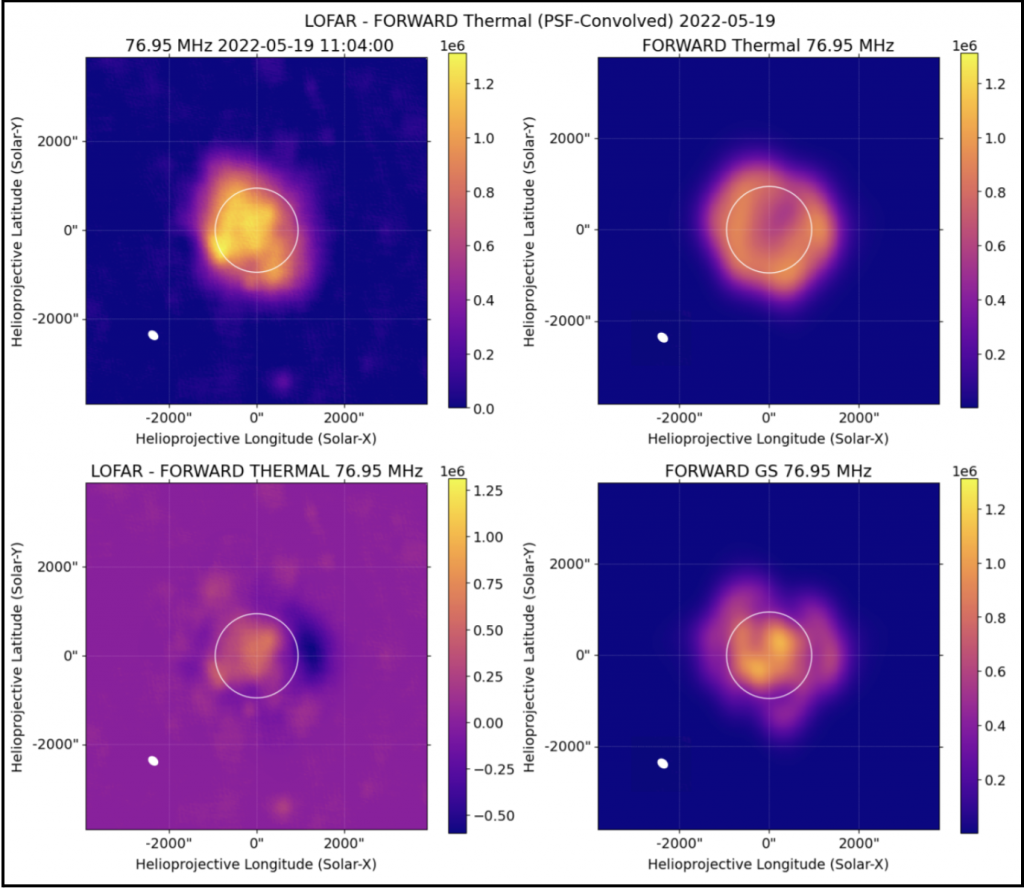
To create synthetic GS images, we ran grids of Fast GS codes models with 3000 combinations of [n,T,B] each, between 20-300 MHz with 100 frequency points. We saved results to look-up tables, and created functions for computing linear interpolation between input plasma values. Grid runs were performed for nine separate combinations of non-thermal electron density (nb), minimum (Emin) and maximum (Emax) beam energy. In order to construct GS synthetic images, we sampled the [n,T,B] values in the FORWARD plasma quantity maps (shown in Fig. 2) pixel by pixel, following a previously developed method under this project. For each pixel, we extracted the spectrum corresponding most closely to the plane-of-sky [n,T,B] values, and recorded the GS intensity for a desired frequency on the GS image array.
This approach has two main limitations, which we hope to overcome in future work. First, using a plane-of-sky plasma value equals the assumption that the coronal plasma does not change along the line of sight, which is not correct. Second, the images are only generated for a given combination of [nb, Emin, Emax], which does not change for different locations on and off the solar disk. We expect that these parameters should change in different areas of the solar surface and corona, for example active regions versus coronal holes. We will relax this assumption in future work as well.